
IC Markets cTrader comparison
AurumTwelve12 XAU
v1.32 Backtest
A lower-drawdown broker comparison backed by the complete supplied cTrader ledger.

Reconciled from the cTrader report and 1,073 ledger rows
Backtest summary
Net results include the commission and swaps recorded in the export. The complete report, 18,873 Events records and exact cBot parameters are preserved below for independent checking.
Portfolio attribution
Strategy lanes that produced trades
Eight lanes generated closed trades during this IC Markets test.
Platform-captured evidence
Equity curve and completed history
The supplied screenshots are from this same completed IC Markets cTrader run. The downloadable cTrader report, Events ledger and parameter set preserve the underlying evidence.
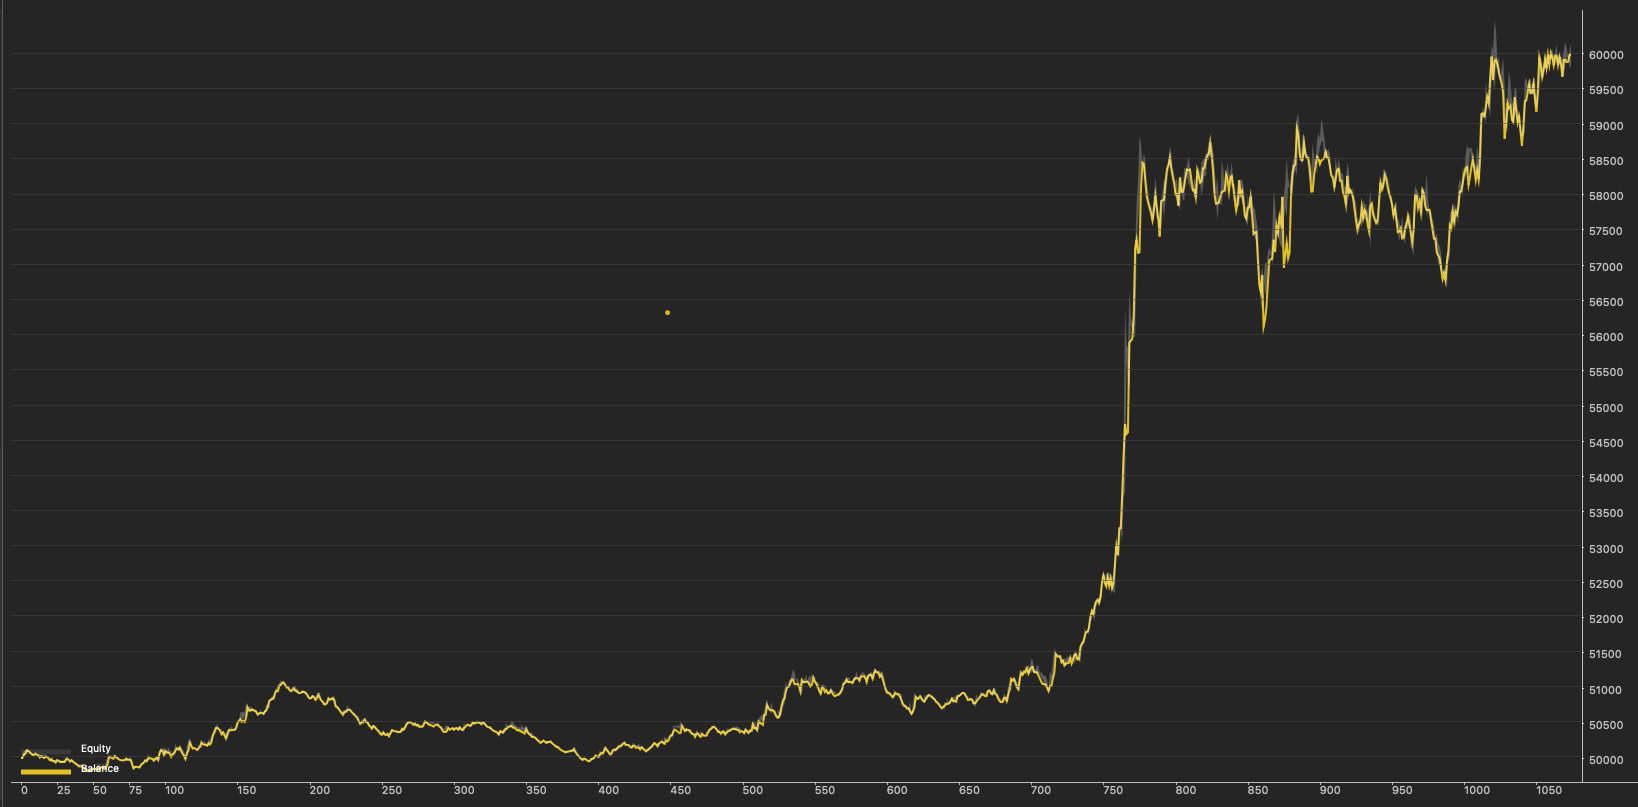
The curve finishes near $60,000 from a $50,000 start. Growth accelerates late in the test, so the +19.96% return should be read together with the 4.25% maximum equity drawdown.
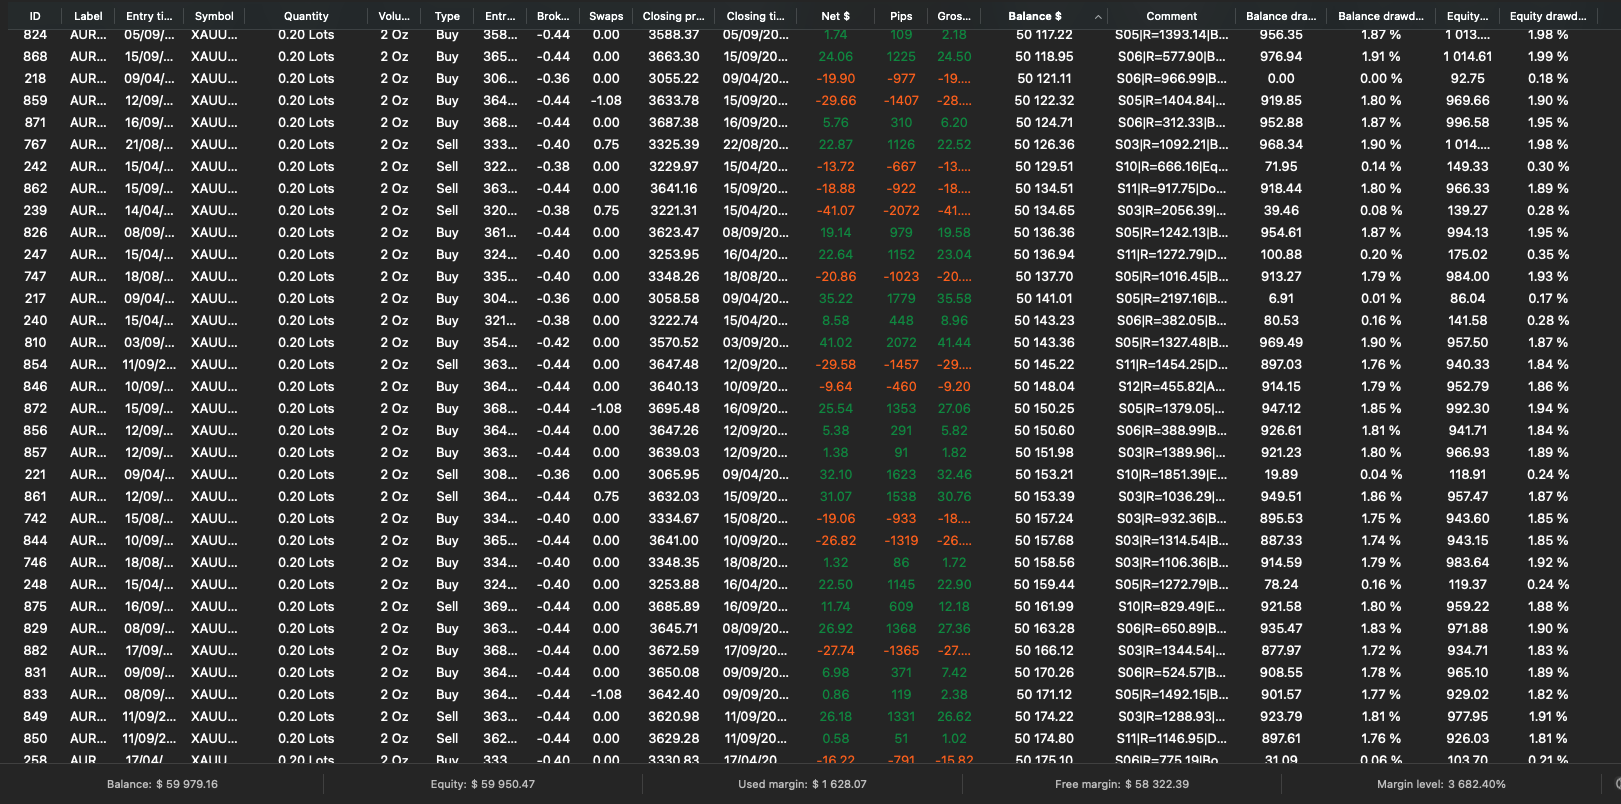
Complete source ledger
All 1,073 closed trades
Search by strategy, direction, date, comment or ID.
Loading full trade history…
| ID | Strategy | Entry (UTC) | Close (UTC) | Side | Quantity | Entry | Close | Net | Pips | Balance | Comment |
|---|
Backtest and risk disclosure
This is a historical simulation, not a live statement or guarantee. Broker data, commission, swaps, spread, slippage, sizing, settings and dates can materially change results. A 4.25% overall maximum equity drawdown does not by itself prove compliance with any prop-firm daily-loss rule.
Source: IC Markets AU cTrader report, History export, Events ledger and parameter set captured 13 July 2026. The runtime log completed without a cBot crash or execution error.